Telemetry
AuthProxy emits OpenTelemetry traces, metrics, and logs from every service (api, admin-api, public, worker). All three signals are configured through a single telemetry: block and shipped via OTLP to a Collector you supply. Telemetry is off by default — existing deployments are unaffected until you opt in.
Quick start
Section titled “Quick start”telemetry: enabled: true exporter: protocol: grpc endpoint: env_var: AUTHPROXY_OTEL_ENDPOINT default: "" insecure: trueWith the endpoint pointing at a real OTLP gRPC collector (localhost:4317 for the in-repo dev sample), AuthProxy starts exporting traces / metrics / logs immediately. When AUTHPROXY_OTEL_ENDPOINT is unset and the default is "", the SDK falls through to no-op providers — see default-off behaviour.
For the canonical dev_config/default.yaml example see dev_config/observability/README.md.
Default-off behaviour
Section titled “Default-off behaviour”When the telemetry: block is absent or enabled: false, every OTel provider in every service is a no-op:
- No exporter is dialled.
- No resource is initialised beyond the SDK defaults.
- The handful of instrumented surfaces (HTTP middleware, outbound roundtripper, DB driver, Redis hooks, Asynq middleware, OAuth2 lifecycle, slog handler) call into no-op SDK implementations, paying only the cost of a method dispatch.
There is also an endpoint-gated soft-disable: if enabled: true but exporter.endpoint resolves to an empty string (typical when the env var binding is unset and the default is ""), the SDK still returns no-op providers and logs nothing. This is what lets dev_config/default.yaml ship a fully-populated telemetry: block without any side effects until the operator opts in by setting AUTHPROXY_OTEL_ENDPOINT.
Upgrading from a pre-telemetry version is a no-op until you add the telemetry: block.
Signals
Section titled “Signals”| Signal | Enabled when | Source | Notes |
|---|---|---|---|
| Traces | signals.traces: true (default true) |
All instrumented subsystems | Parent-based head sampling; honors inbound W3C trace context. |
| Metrics | signals.metrics: true (default true) |
All instrumented subsystems + asynq queue depth gauge | Cumulative temporality by default. Set OTEL_EXPORTER_OTLP_METRICS_TEMPORALITY_PREFERENCE=delta for delta. |
| Logs | signals.logs: true (default true) |
slog records via the contrib otelslog bridge |
The base handler (tint / JSON) still emits to stderr — fan-out is additive. |
Toggling a signal off while telemetry is enabled keeps the corresponding provider as a no-op. Other signals continue to flow.
Span coverage
Section titled “Span coverage”| Subsystem | Span name | Span kind | Key attributes |
|---|---|---|---|
| Inbound HTTP (Gin) | HTTP {method} |
server | http.request.method, http.route, http.response.status_code, url.path, authproxy.service |
Outbound proxy (httpf) |
HTTP {method} |
client | semconv HTTP client + authproxy.request.type, authproxy.namespace, authproxy.connector_id, authproxy.connector_version, authproxy.connection_id, plus allowlisted labels (see Label projection) |
Postgres / SQLite (database/sql) |
sql.conn.query, sql.rows, … |
client | semconv DB + db.system (postgresql, sqlite, clickhouse) |
Redis (apredis) |
redis.{command} |
client | semconv Redis + key (name only, never values) |
| Asynq handlers + scheduler | asynq.task {type} and asynq.scheduler.sync |
consumer / internal | messaging.system=asynq, messaging.destination.name, messaging.message.id, authproxy.asynq.task_type, authproxy.asynq.retry_count, authproxy.asynq.max_retry |
| OAuth2 lifecycle | oauth2.token_exchange, oauth2.refresh, oauth2.revoke |
client | authproxy.connector_id, authproxy.oauth2.operation |
Health and readiness endpoints (/ping, /healthz) are excluded from spans and metrics by default — configurable via telemetry.http.excluded_paths. Token contents, refresh payloads, and other secrets are never captured as span attributes.
Metrics catalog
Section titled “Metrics catalog”HTTP server
Section titled “HTTP server”http.server.request.duration— histogram (seconds). Dimensions:http.request.method,http.response.status_code,http.route,authproxy.service.http.server.active_requests— up-down counter. Dimensions:http.request.method,authproxy.service.
Outbound proxy
Section titled “Outbound proxy”authproxy.client.request.duration— histogram (seconds). Dimensions:http.request.method,http.response.status_code,authproxy.request.type,authproxy.connector_id, plus allowlisted metric-dimension labels.authproxy.client.request.body.size— histogram (bytes). Emitted only whenContent-Lengthis known.authproxy.client.response.body.size— histogram (bytes). Same.
Database (otelsql)
Section titled “Database (otelsql)”Standard go.sql.connection.* gauges (open / in-use / idle / wait counts) when metrics are enabled — registered via otelsql.RegisterDBStatsMetrics. Per-query histograms emitted by the same instrumentation.
Redis (redisotel)
Section titled “Redis (redisotel)”Standard db.client.connections.* and per-command histograms emitted by the redis/go-redis contrib bridge.
authproxy.asynq.task.duration— histogram (seconds). Dimensions:authproxy.asynq.task_type,messaging.destination.name(queue),authproxy.asynq.result(success/error).authproxy.asynq.queue.size— observable gauge. Dimensions:messaging.destination.name. Polled via the Asynq Inspector on each metric collection.
OAuth2 lifecycle
Section titled “OAuth2 lifecycle”authproxy.oauth2.refresh.attempts.total{result}— counter.authproxy.oauth2.refresh.failures.total{reason}— counter.reasonuses the same enumeration as the structured failure events (invalid_grant,provider_5xx,network_error,no_refresh_token,malformed_response,internal_error, …).authproxy.oauth2.revocations.total{revocation_kind, result}— counter.kindisrefresh_token/access_token.authproxy.oauth2.token_exchange.attempts.total{result}— counter.authproxy.oauth2.token_exchange.failures.total{reason}— counter.
OAuth2 counters also receive any allowlisted connection-label dimensions from telemetry.proxy.metric_dimension_labels (e.g. type=google_drive, env=prod). The raw authproxy.connector_id is intentionally not emitted as a metric attribute — see the label projection section.
Configuration reference
Section titled “Configuration reference”Full schema, with comments. Every field is optional unless noted.
telemetry:  enabled: true                       # default false (block absent / false → no-op)
  exporter:    protocol: grpc                    # grpc (default) | http/protobuf    endpoint:                         # StringValue — supports env_var fallthrough      env_var: AUTHPROXY_OTEL_ENDPOINT      default: ""                     # empty default → endpoint-gated soft-disable    headers:                          # map<string, StringValue> — env_var fallthrough on each value      authorization:        env_var: OTEL_HEADER_AUTH        default: ""    insecure: true                    # disable TLS on the OTLP connection
  resource:    service_name_prefix: authproxy    # prepended to service id (e.g. authproxy-api). Default "authproxy".    attributes:                       # static key/value resource attrs      deployment.environment: prod
  sampling:    ratio: 1.0                        # parent-based head ratio. 0..1. Default 1.0.
  signals:    traces: true                      # default true (when telemetry.enabled)    metrics: true    logs: true
  http:    excluded_paths:                   # paths excluded from inbound HTTP spans + metrics      - /ping      - /healthz
  proxy:    span_attribute_labels:            # connection-label keys to project as proxy span attributes      - type      - env      - tenant_id    metric_dimension_labels:          # connection-label keys to project as metric attributes (proxy + oauth2)      - type      - env    metric_dimension_value_cap: 50    # max distinct values per metric dim key; overflow collapses to "other"
  propagation:    inject_outbound_default: false    # global default for W3C traceparent injection on outbound calls
Per-connector overrides for trace context propagation live on the connector definition:
connectors: load_from_list: - labels: type: google-drive auth: { type: OAuth2, ... } telemetry: propagate_trace_context: true # overrides telemetry.propagation.inject_outbound_default for this connectorStandard OTEL_* env vars
Section titled “Standard OTEL_* env vars”The SDK honors the standard OpenTelemetry environment variables. YAML values take precedence; env vars fill in unset fields. The most common:
OTEL_EXPORTER_OTLP_ENDPOINT— exporter endpoint (overridden bytelemetry.exporter.endpoint).OTEL_EXPORTER_OTLP_HEADERS— comma-separatedk=vpairs (overridden bytelemetry.exporter.headers).OTEL_EXPORTER_OTLP_PROTOCOL—grpcorhttp/protobuf(overridden bytelemetry.exporter.protocol).OTEL_RESOURCE_ATTRIBUTES— comma-separatedk=vpairs merged into the resource alongsidetelemetry.resource.attributes.OTEL_SERVICE_NAME— overridesresource.service_name_prefix + "-" + service_idif set.OTEL_METRIC_EXPORT_INTERVAL— milliseconds. The SDK default is 60s; set to a smaller value for interactive dev (the dev sample uses5000).OTEL_EXPORTER_OTLP_METRICS_TEMPORALITY_PREFERENCE—cumulative(default — required for Prometheus exporters) ordelta. The dev sample setscumulativeexplicitly.
Label projection
Section titled “Label projection”AuthProxy carries arbitrary Kubernetes-style labels on namespaces, connectors, connections, and per-request via ProxyRequest.Labels. Telemetry projects an operator-allowlisted subset of these onto span attributes and metric dimensions — never the full set, so cardinality stays under your control even with thousands of connectors / tenants.
Where the labels come from
Section titled “Where the labels come from”Each proxy request has a single effective label set built up by inheritance:
- Connector labels — defined on the connector YAML (
labels: { type: google-drive, env: prod }). - Connection labels — a connection inherits its connector’s labels at creation; users may add or override.
- Request labels —
ProxyRequest.Labelssupplied by the caller ofPOST /connections/:id/_proxy.
These are merged into httpf.RequestInfo.Labels via ForConnection (copies connection labels in) followed by ForLabels (overlays request labels; request wins on key conflict). By the time the proxy executes, RequestInfo.Labels is the single computed effective set for that request. Telemetry reads from this set and applies the allowlists below. Telemetry does no merging of its own.
Two independent allowlists
Section titled “Two independent allowlists”Two separate keys in the config control projection:
telemetry.proxy.span_attribute_labels— keys whose values become span attributes on outbound proxy spans. Cheap; can tolerate higher cardinality.telemetry.proxy.metric_dimension_labels— keys whose values become metric dimensions on outbound proxy metrics (also applied to OAuth2 lifecycle counters). Strictly bounded — every new value adds to the active series count in Prometheus.
A key in span_attribute_labels but not metric_dimension_labels shows up only on spans. Keys missing from both are dropped entirely. Keys not present in the effective set produce no attribute — they are absent, not empty strings.
Value cap
Section titled “Value cap”telemetry.proxy.metric_dimension_value_cap (off by default — set to a positive integer to enable) caps the number of distinct values per metric-dimension key. Once a key has admitted that many values, every new distinct value collapses to the literal string "other". Previously-admitted values keep passing through verbatim. The cap is per-process and per-key — a multi-replica deployment caps independently on each replica.
This is the cardinality safety net for any allowlisted label whose value space might grow unboundedly (tenant_id, customer_id, etc.).
Trace context propagation
Section titled “Trace context propagation”Outbound proxy requests do not inject W3C traceparent / tracestate by default. Propagation to a 3rd-party service is opt-in because some providers reject unknown headers or log them in unexpected ways.
Two knobs control this:
- Global default:
telemetry.propagation.inject_outbound_default(defaultfalse). - Per-connector override:
telemetry.propagate_trace_contexton the connector definition. Overrides the global default for outbound calls routed through that connector.
Inbound services accept incoming W3C headers via a parent-based sampler unconditionally — that’s the normal OTel inbound contract and does not depend on this setting.
Error and exception capture
Section titled “Error and exception capture”| Surface | Behaviour |
|---|---|
| Inbound HTTP 5xx | Span status Error. httperr.Error metadata attached as span attributes. |
| Inbound HTTP 4xx | Span status Unset. Per OTel HTTP semantic conventions — client mistakes are not service errors. |
| Inbound HTTP panic | Telemetry-aware recovery middleware records the panic as an exception event on the active span before delegating to the standard gin.Recovery 500 path. |
| Outbound proxy 5xx | Client span status Error. |
| Outbound transport error | Client span status Error. RecordError adds an exception event with the underlying error. |
| Asynq handler error | Span status Error, exception event recorded, authproxy.asynq.result=error on the metric. |
| OAuth2 lifecycle failure | Span status Error, exception event recorded, failure counter incremented with reason=<category>. |
| SQL / Redis error | Span status Error via the underlying contrib instrumentation. |
Sampling
Section titled “Sampling”Parent-based head sampling, with a configurable ratio (telemetry.sampling.ratio, default 1.0). Sampling decisions made by upstream callers (via the inbound traceparent) are honored — services downstream of an upstream sampler will respect what the parent decided.
Tail-based sampling is the Collector’s job, not AuthProxy’s.
Logs and trace correlation
Section titled “Logs and trace correlation”When telemetry is initialized, a thin wrapper around slog’s handler:
- Always stamps
trace_id+span_idon every record emitted in a context that carries a recording span. This works regardless of whethersignals.logsis on — operators who only enable traces still benefit from log↔trace correlation as soon as someone starts a span. - When
signals.logs: true, additionally fans every record through theotelslogcontrib bridge so logs ship via OTLP alongside traces + metrics. The original sink (tint / JSON to stderr) keeps emitting — fan-out is additive.
The existing LogRecord.CorrelationId field (the request-log entity, unrelated to OTel) is independent of trace_id. Logs emitted within a traced request carry both, satisfying any downstream system that depends on either id.
Service identity
Section titled “Service identity”Each of the four services reports a distinct service.name:
| Service id | OTel service.name |
|---|---|
api |
authproxy-api |
admin-api |
authproxy-admin-api |
public |
authproxy-public |
worker |
authproxy-worker |
The prefix (authproxy) is configurable via telemetry.resource.service_name_prefix. Other resource attributes:
service.version— from the build info (or empty in dev runs without an embedded version)service.instance.id— random UUID per process start- everything in
telemetry.resource.attributesandOTEL_RESOURCE_ATTRIBUTES
Local dev sample (grafana/otel-lgtm)
Section titled “Local dev sample (grafana/otel-lgtm)”A one-command local observability stack ships under a new observability compose profile.
docker compose --profile observability up -dexport AUTHPROXY_OTEL_ENDPOINT=http://localhost:4317go run ./cmd/server serve --config=./dev_config/default.yaml allGrafana is at http://localhost:3000 — no login required. A pre-provisioned dashboard (AuthProxy — Proxy RED + Inbound HTTP) lives under the AuthProxy folder. The full operator runbook with query examples, persistence notes, and limitations is in dev_config/observability/README.md.
A few snapshots from a real run:
| Dashboard — Proxy RED panels (waiting on outbound proxy traffic) | 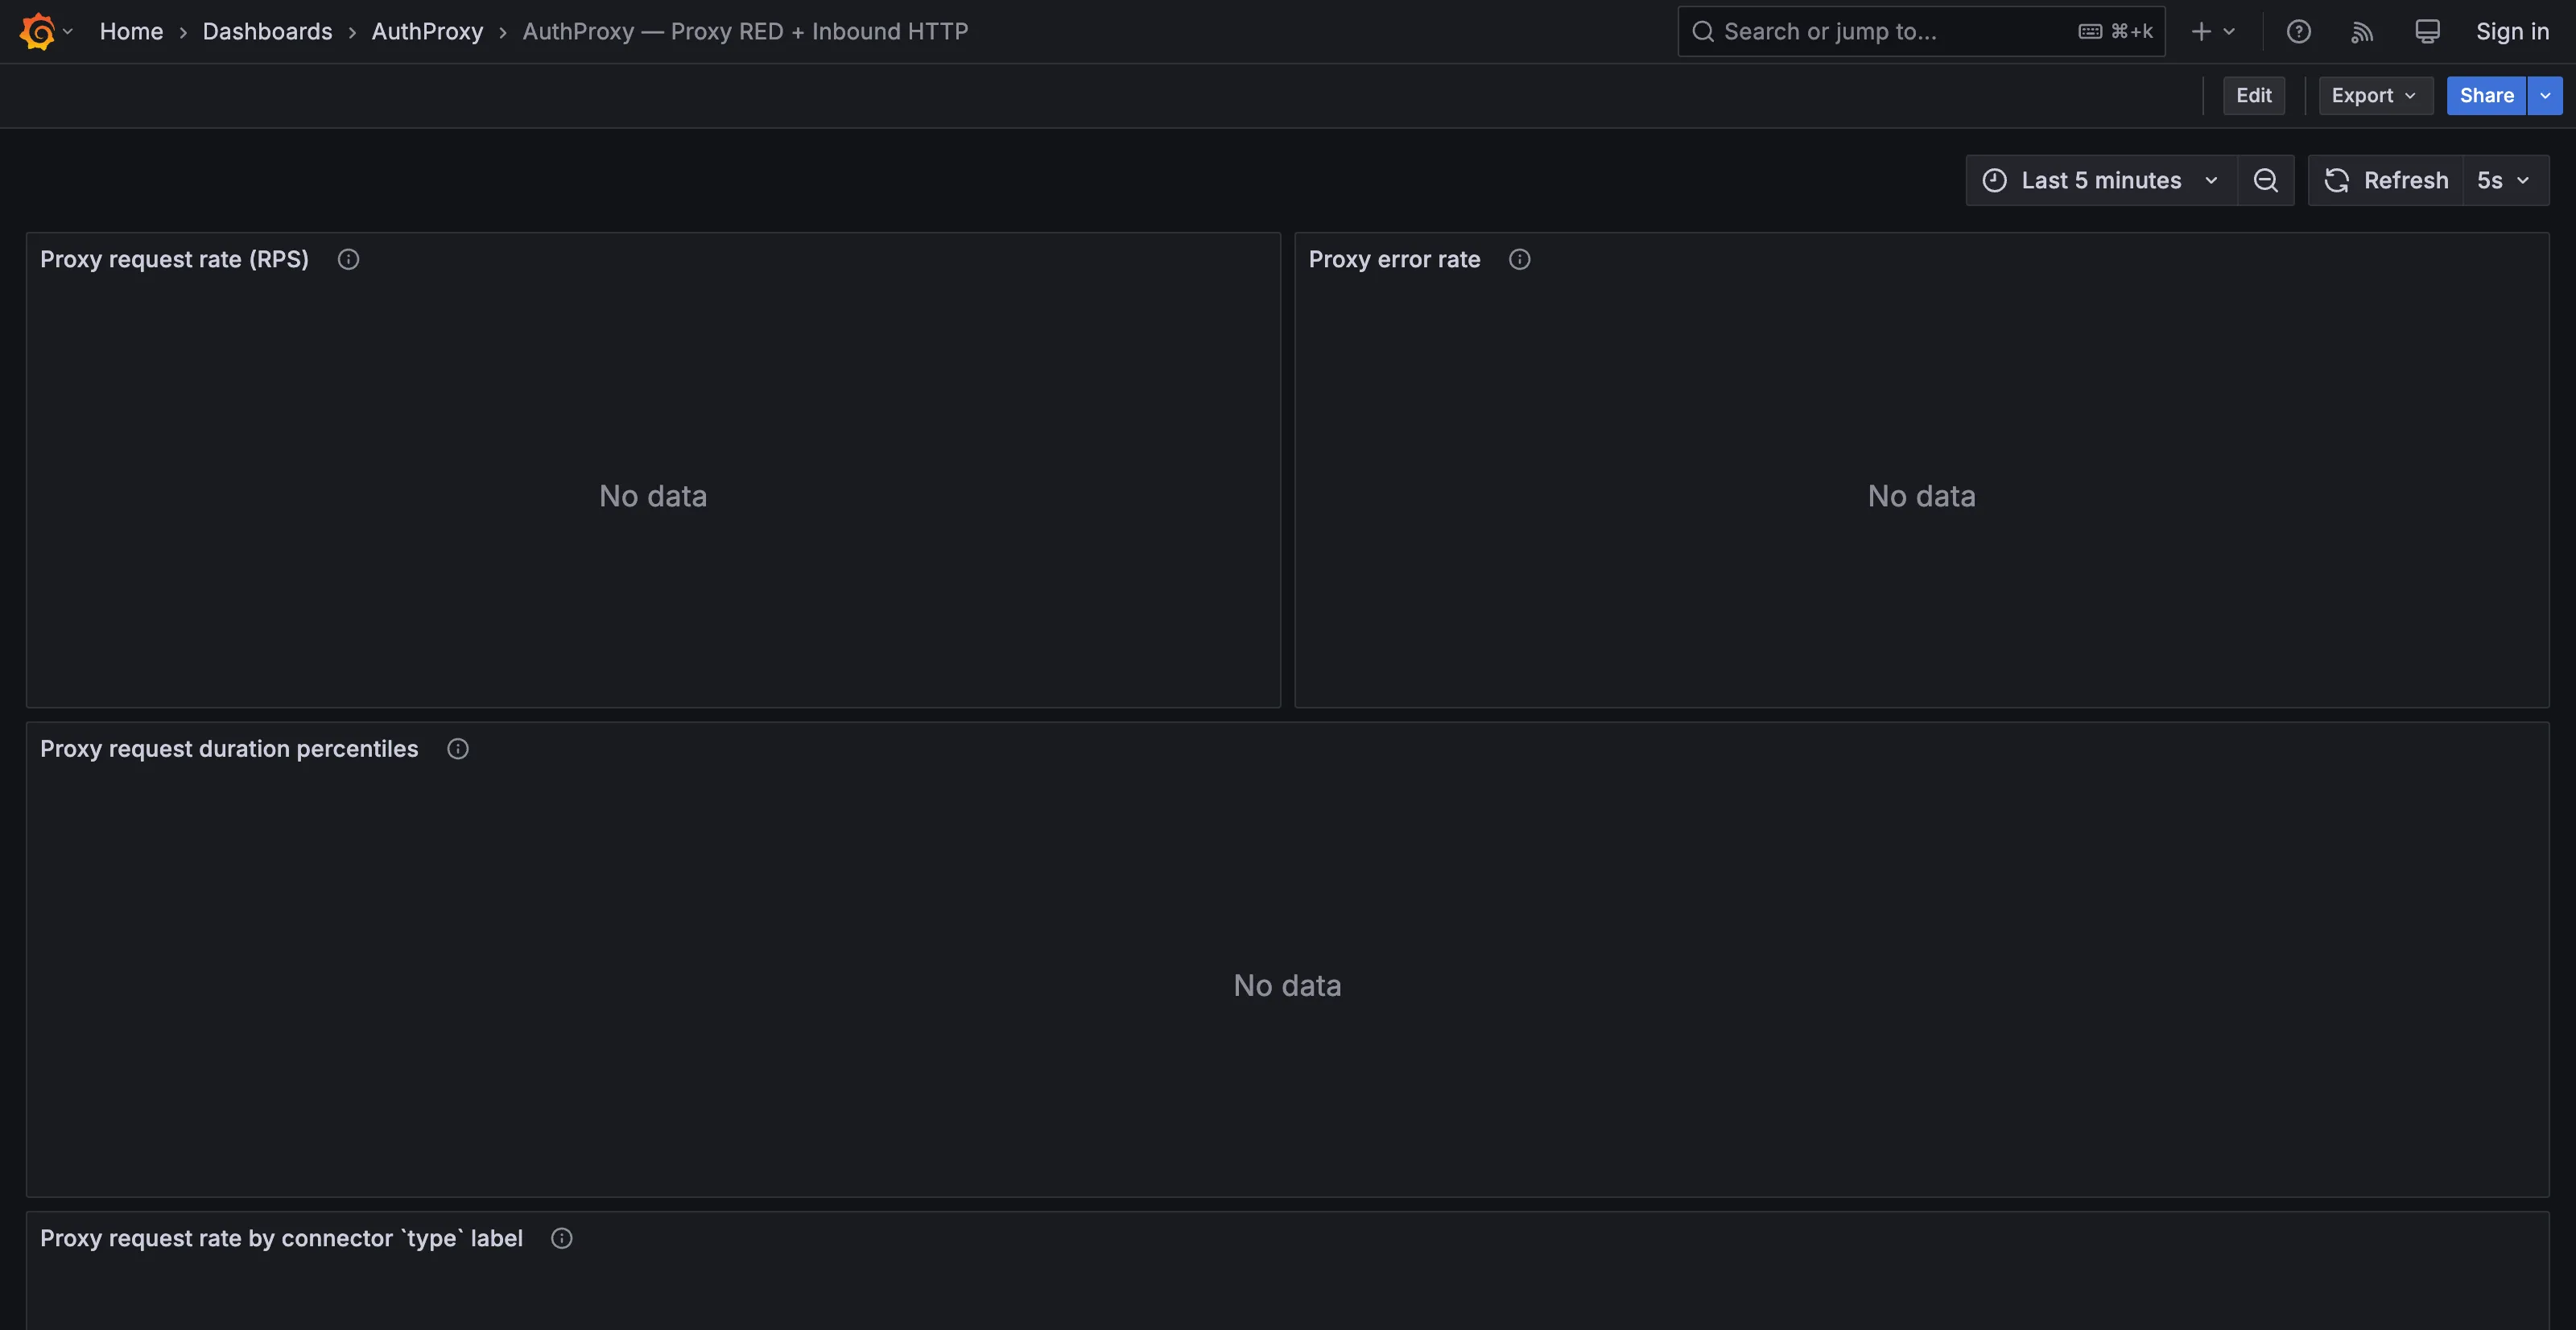 |
| Dashboard — live Inbound HTTP panels | 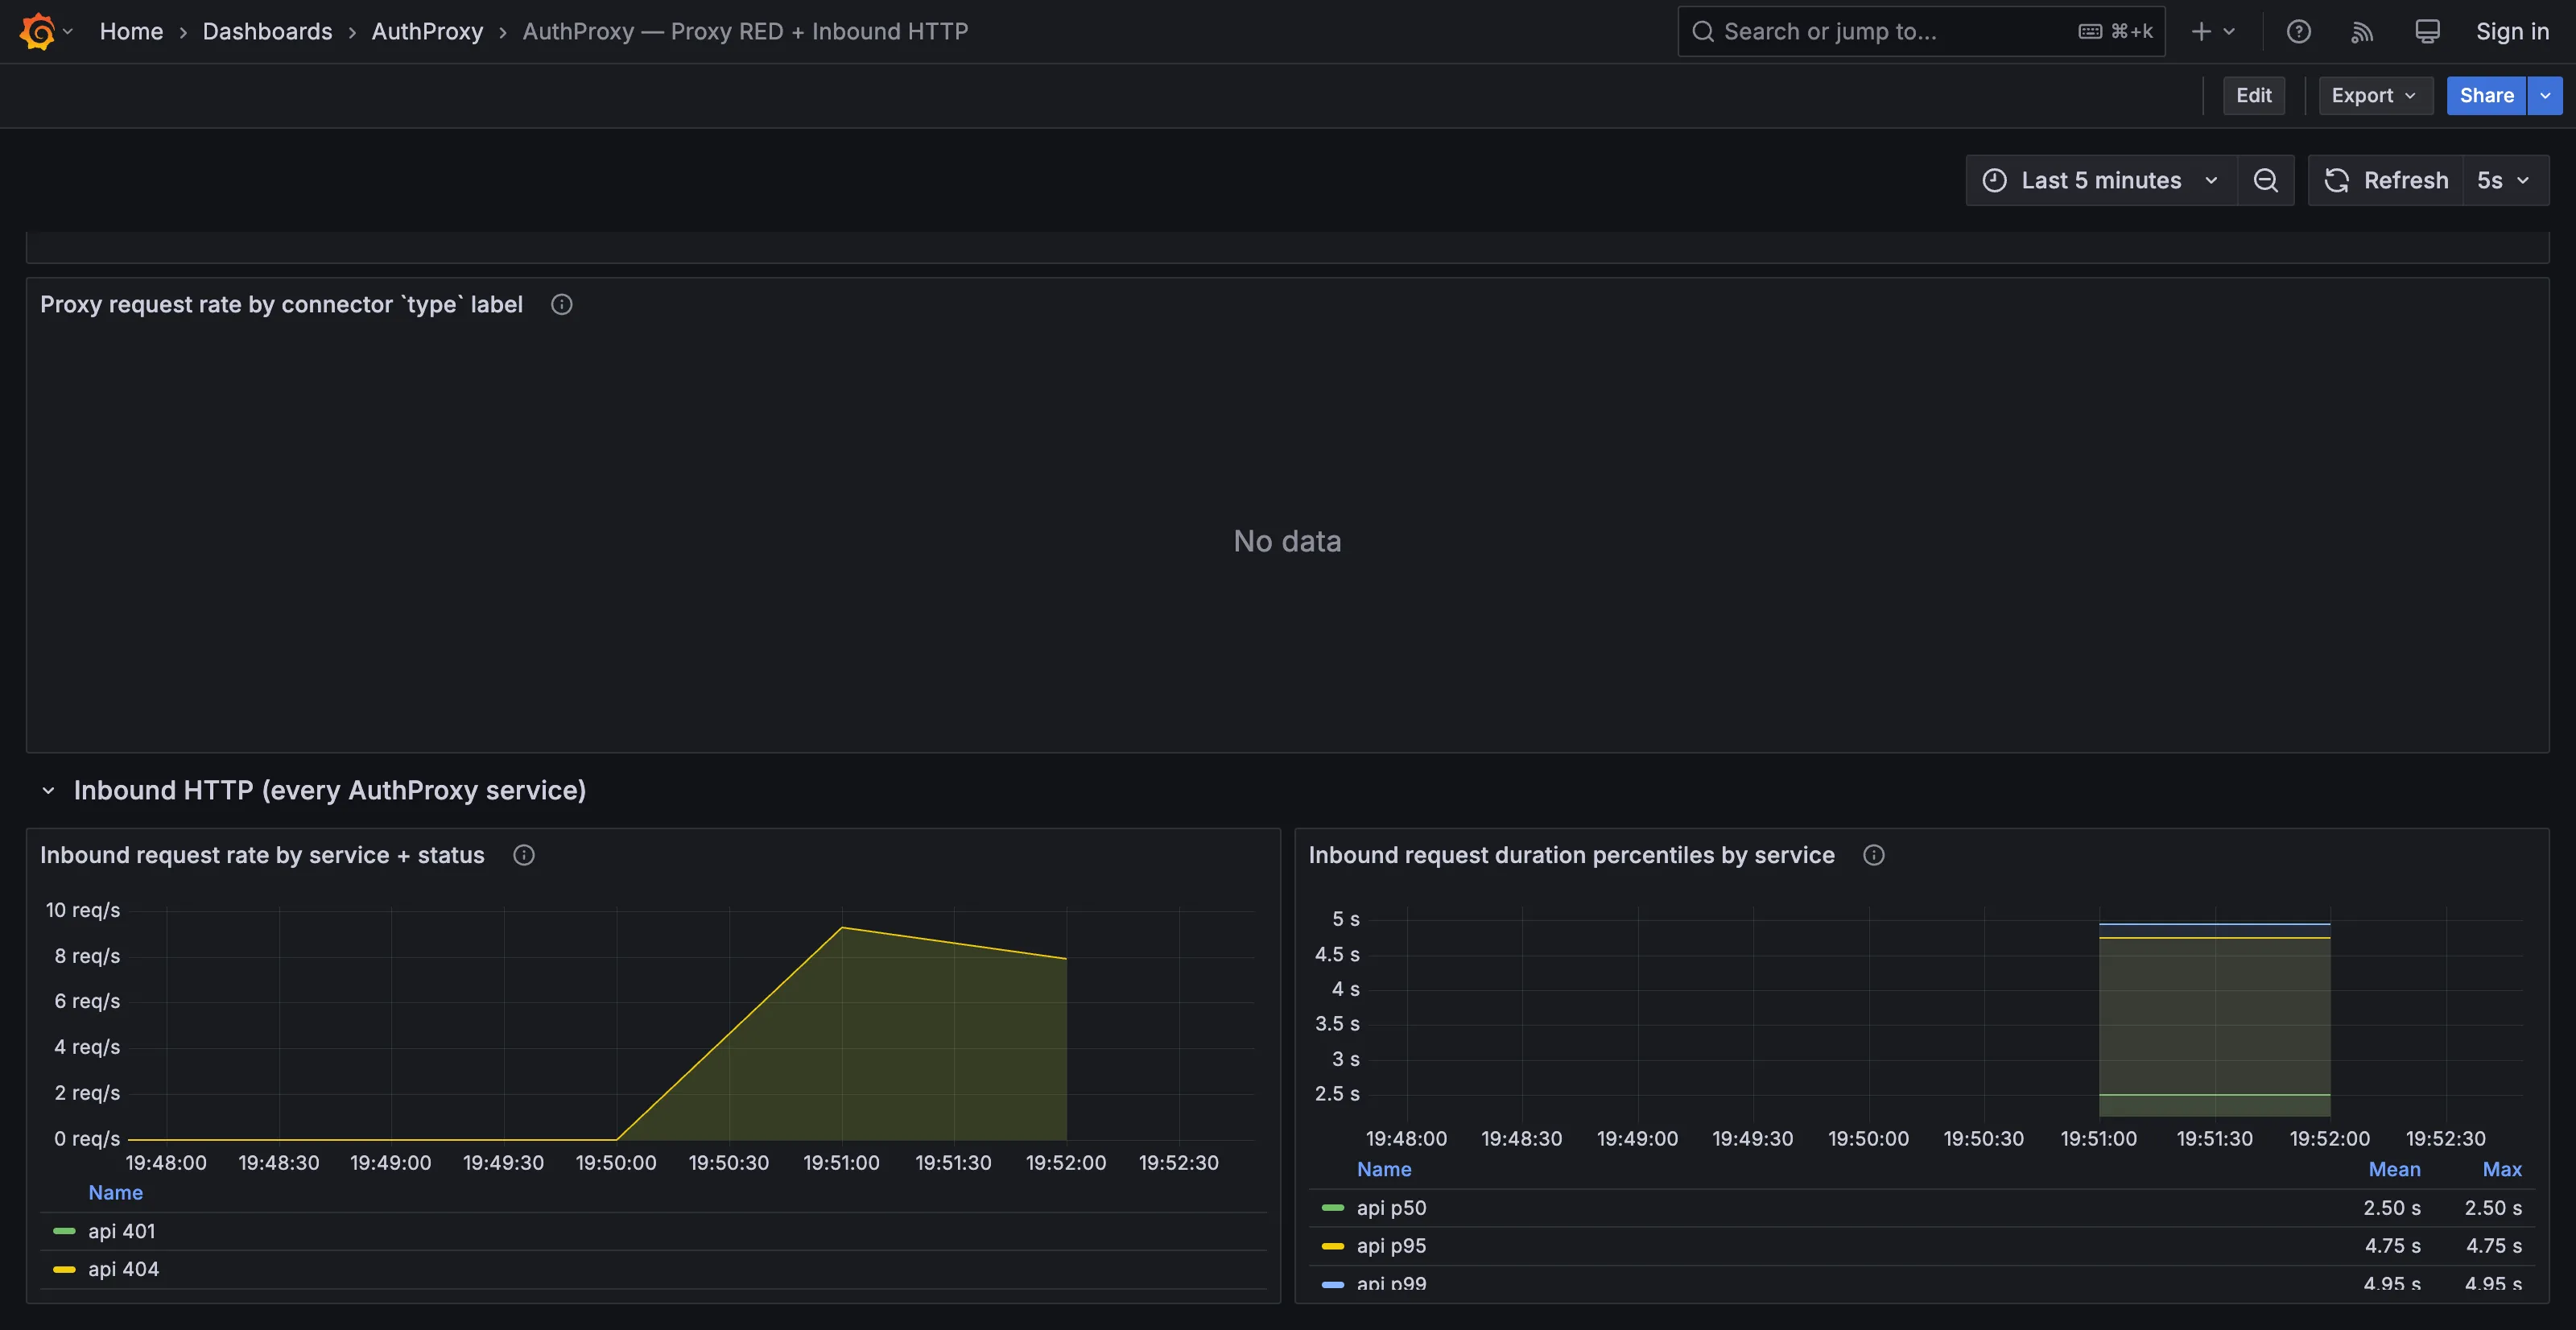 |
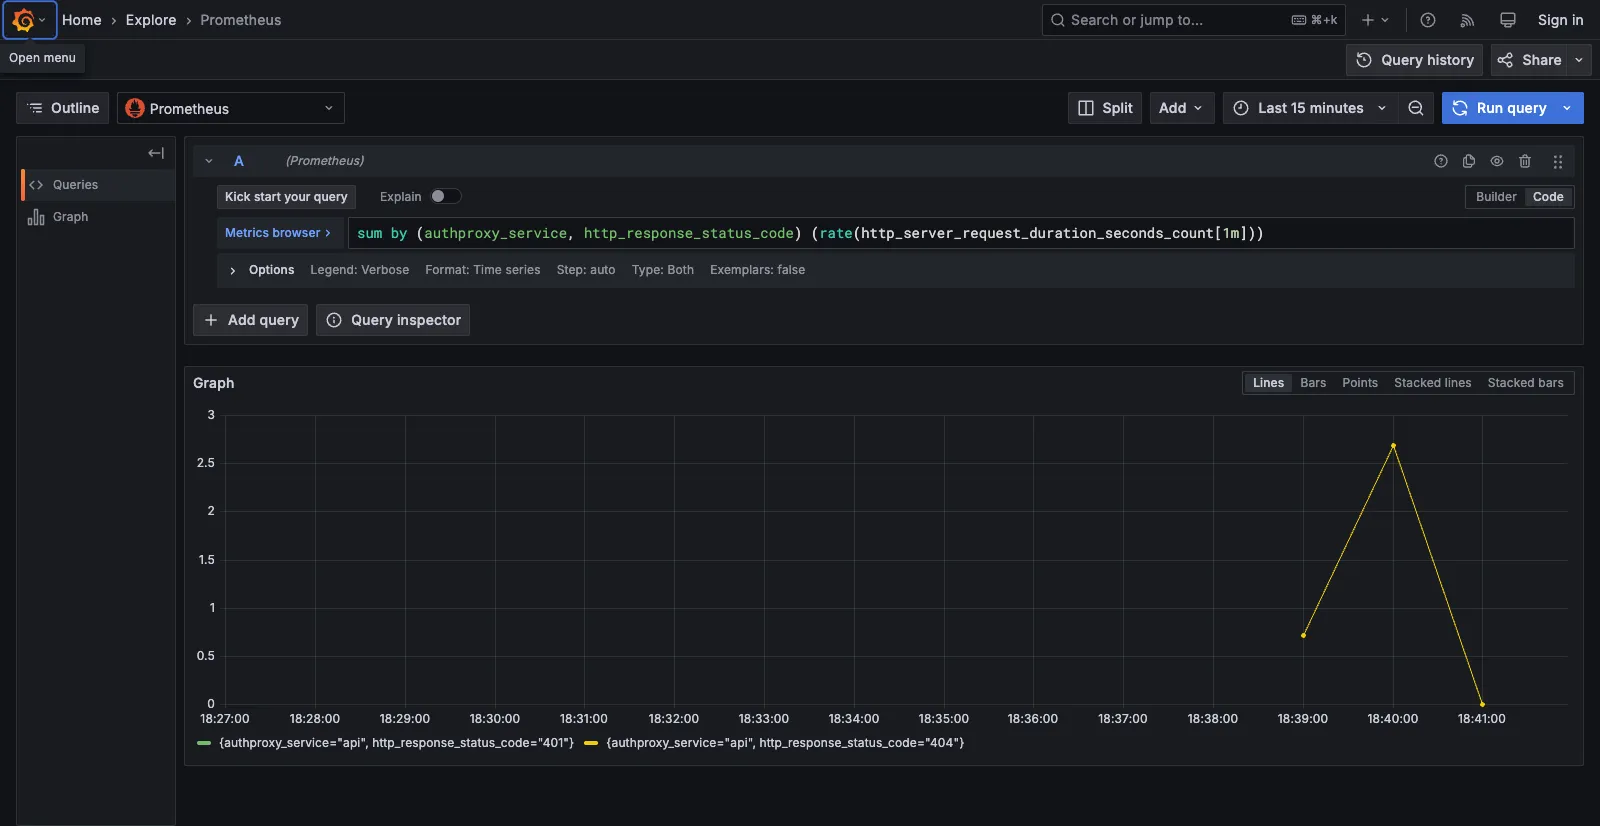
Explore → Prometheus, rate broken out by authproxy_service |
 |
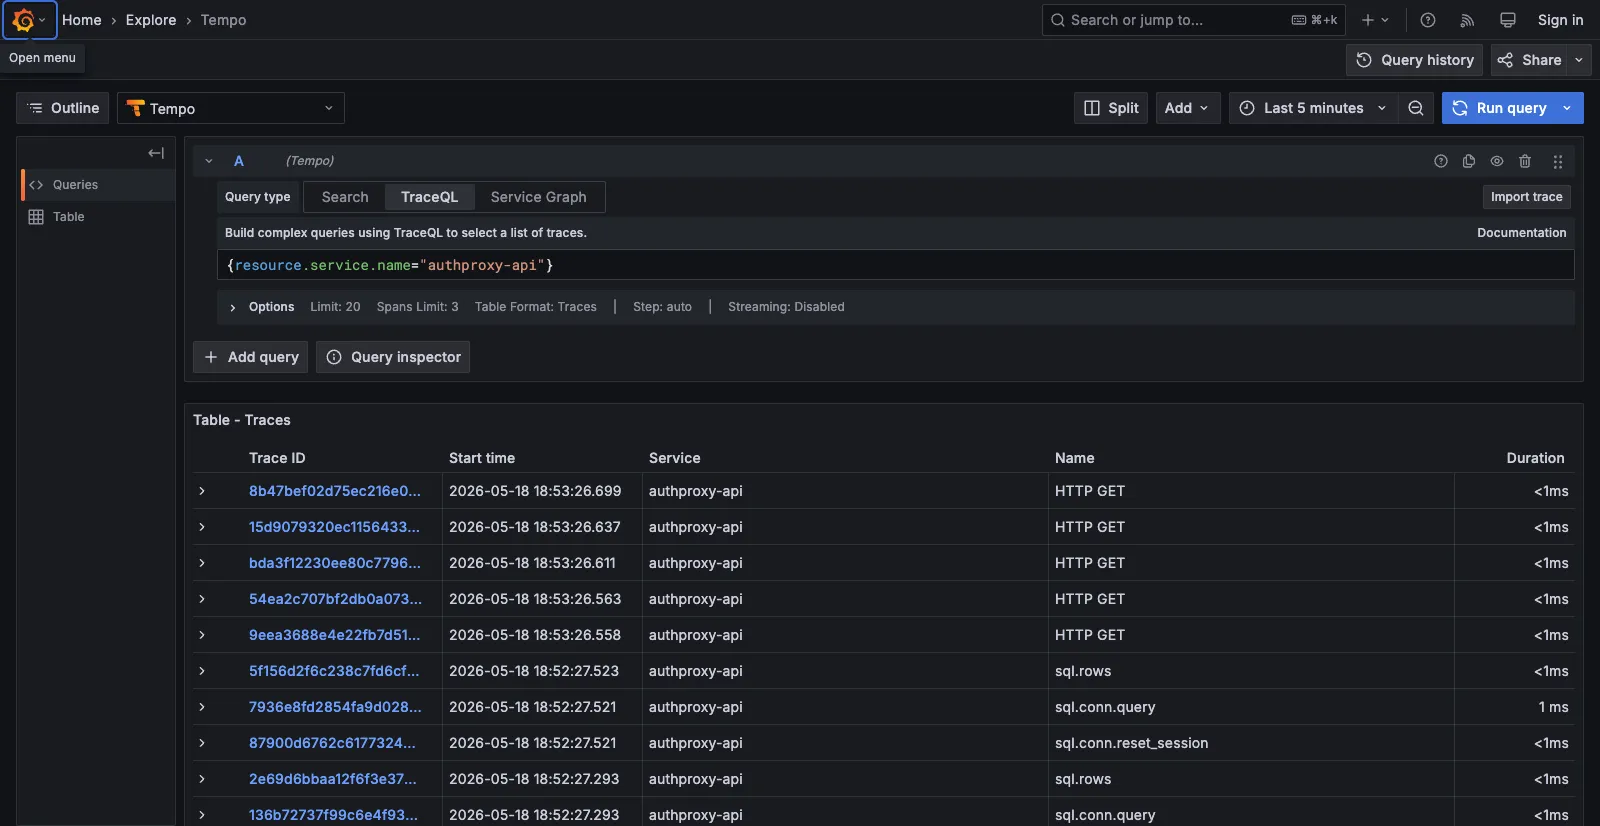
Explore → Tempo, TraceQL search for authproxy-api spans |
 |
Inbound HTTP span detail (GET /api/v1/connectors 401) |
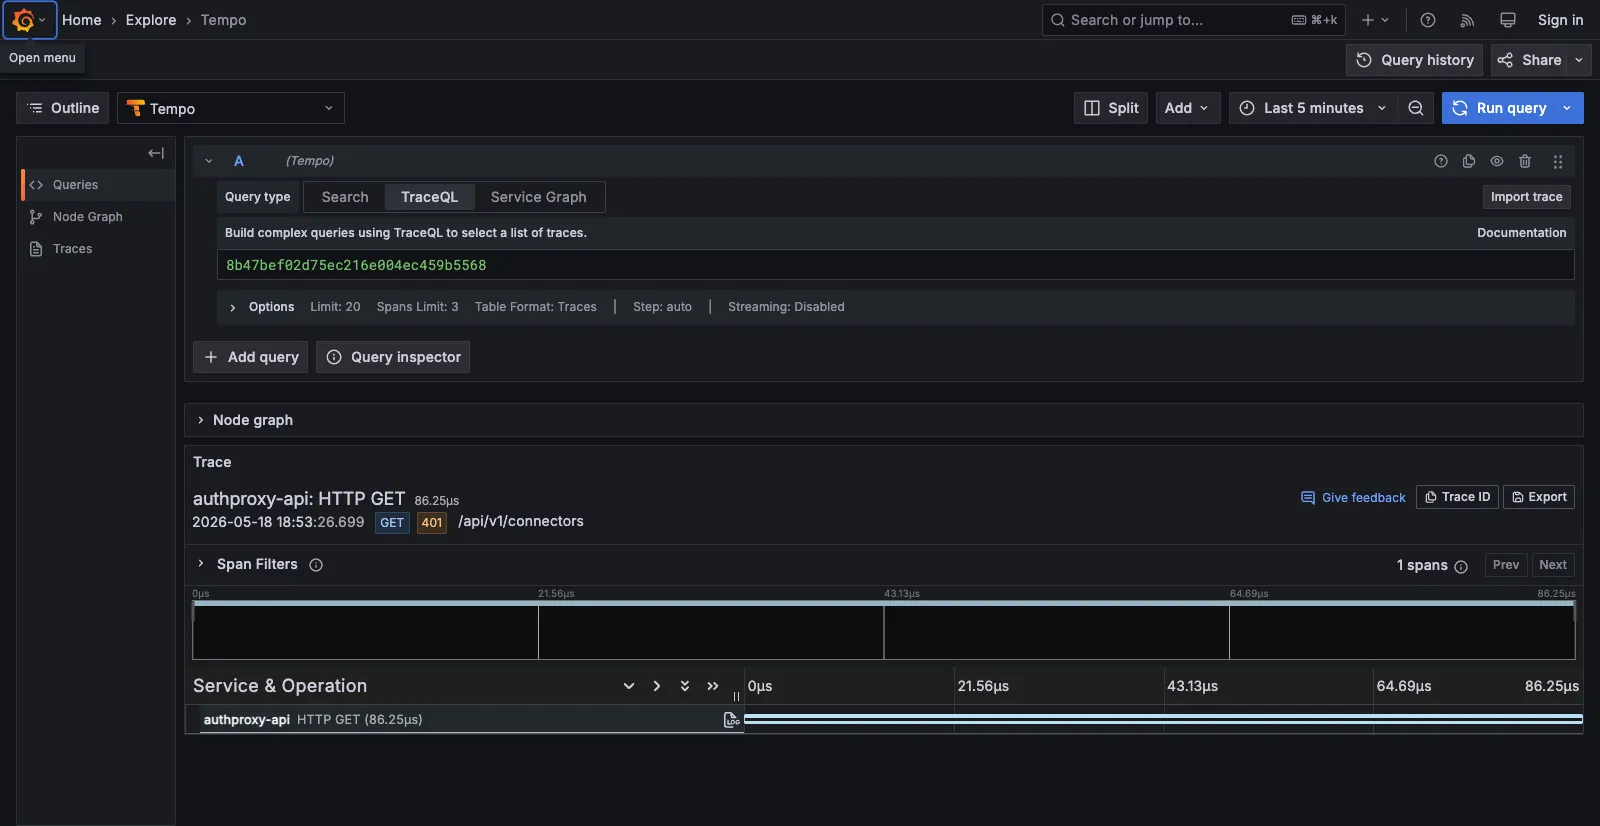 |
sql.conn.query span from the otelsql instrumentation |
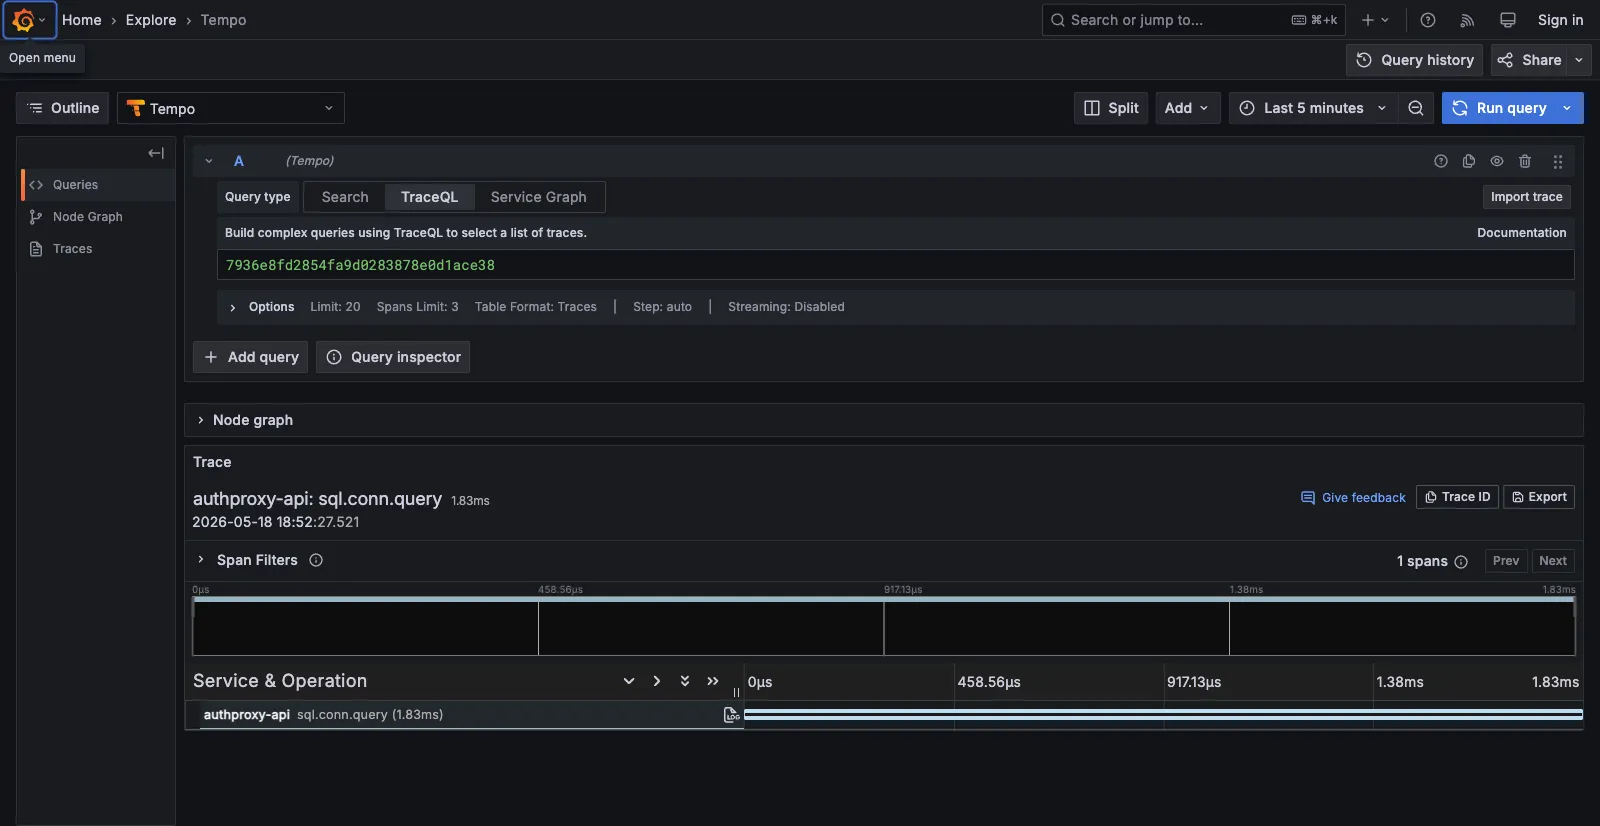 |
For production, terminate OTLP at a real Collector cluster — the bundled stack is a single-container dev convenience with no auth, no HA, and no retention tuning.